![]()
Digging out power lines in 1952
Now that we have all survived the winter of 2017 on Donner Summit, it is time to see how this winter stacks up to those of the past. Donner Summit is famous for its harsh winters and this one was no exception. Once you have lived through one of these big winters, it is human nature to wonder how it ranks with some of the epic ones from the past.
Fortunately, there is a long history of weather data collection at the Summit. In fact, because of the big winters at the Summit, we have our own snow laboratory, the Central Sierra Snow Lab (CSSL). For a history of the lab you can check out this link. Thanks to the CSSL we have extensive weather records for the Summit stretching back to 1879. While there is extensive data about all aspects of the winter weather, this article is going to look at three parameters:
- Cumulative Precipitation – this is the overall accumulation of all forms of precipitation including rain and snow. This parameter is really the basis for the moniker of how “wet” a winter is.
- Cumulative Snow Fall – this is the total accumulation of only the snow that falls during a water year. The majority of precipitation that falls during the winter at the Summit is in the form of snow. However, measurement of the amount of snow differs from actual precipitation due to the variable water content of snow under different conditions and the amount of rain that falls. The contribution of snow to overall precipitation is determined only by the water content of the snow.
- Maximum Snow Pack Depth – This parameter measures the depth of the snow on the ground and is probably the most relevant when it comes to dealing with the consequences of the snow on a day to day level. This is the parameter that determines what the “base” is at ski resorts and how much snow is on your deck and covering the ground.
When you consider these three parameters for the winter of 2017, it turns out they compare quite differently to past years.
Consider the Data
 Before delving into the data, the following conventions need to be considered. Seasonal precipitation is quantified in what is called a Water Year. This is not a calendar year, but the period from October 1 or one year to September 30 of the next. That means that a water year actually includes portions of two calendar years. The designation for a water year is the later of the two years ie: for the winter of 2016-2017 the water year would be designated 2017.
It is also important to understand the sources of the historical data discussed here. The data coming from CSSL is divided into two periods – before and after the 1971 water year. Prior to 1971 only cumulative snowfall and snowpack data was available for this article. The data from 1971 to the present is much more comprehensive and also includes cumulative precipitation data. Much of the analysis discussed here will concentrate on the post 1971 period which many of us can actually remember. Along that same vein, comparisons to the heavy winter of 2011 which is still fresh in our memories will be discussed.
Cumulative Precipitation – The “Wettest” Year on Record
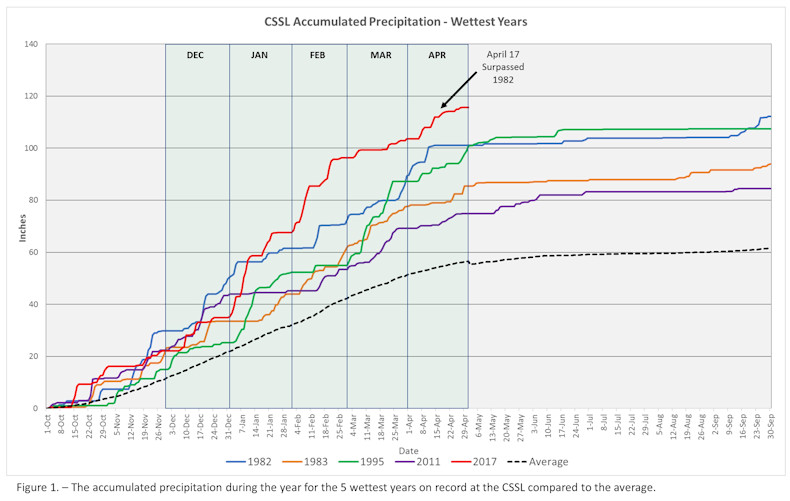
(Drumroll) The 2017 water year has broken the record for the wettest year. This is not only for Donner Summit, but also for all of northern California. The chart in Figure 1 tells the story. Previous to this year the wettest year on record was 1982 at 112 inches. On April 17th of this year, the total precipitation went over that record. While the final numbers won’t be in until September 30th, 2017 can assume the moniker of “wettest” year. However, wettest does not mean the snowiest.
Cumulative Snow Fall
Precipitation comes in two main forms on the Summit, rain and snow. For 2017 the combination of these two forms of precipitation added up to the most ever recorded. It turns out, however, that the portion of that precipitation that fell as snow did not come close to breaking any records as shown in Figures 2 & 3. The historical record for snow fall and snow pack from 1879 to 2017 is shown in chronological order in Figure 2. As the graph shows, there is quite a bit of variability in the amount of snow from winter to winter on the Summit. There are very few people around that can remember the biggest year of 1938 but there are still plenty of accounts around about the winter of 1952 when the Summit received over 800 inches of snow (see this link of the snowbound City of San Francisco). When the top 30 winters are ranked by cumulative snowfall as shown in Figure 3, the year 2017 only comes in at number 20, well back in the pack and significantly less than another recent big snow year, 2011 which came in number 8.
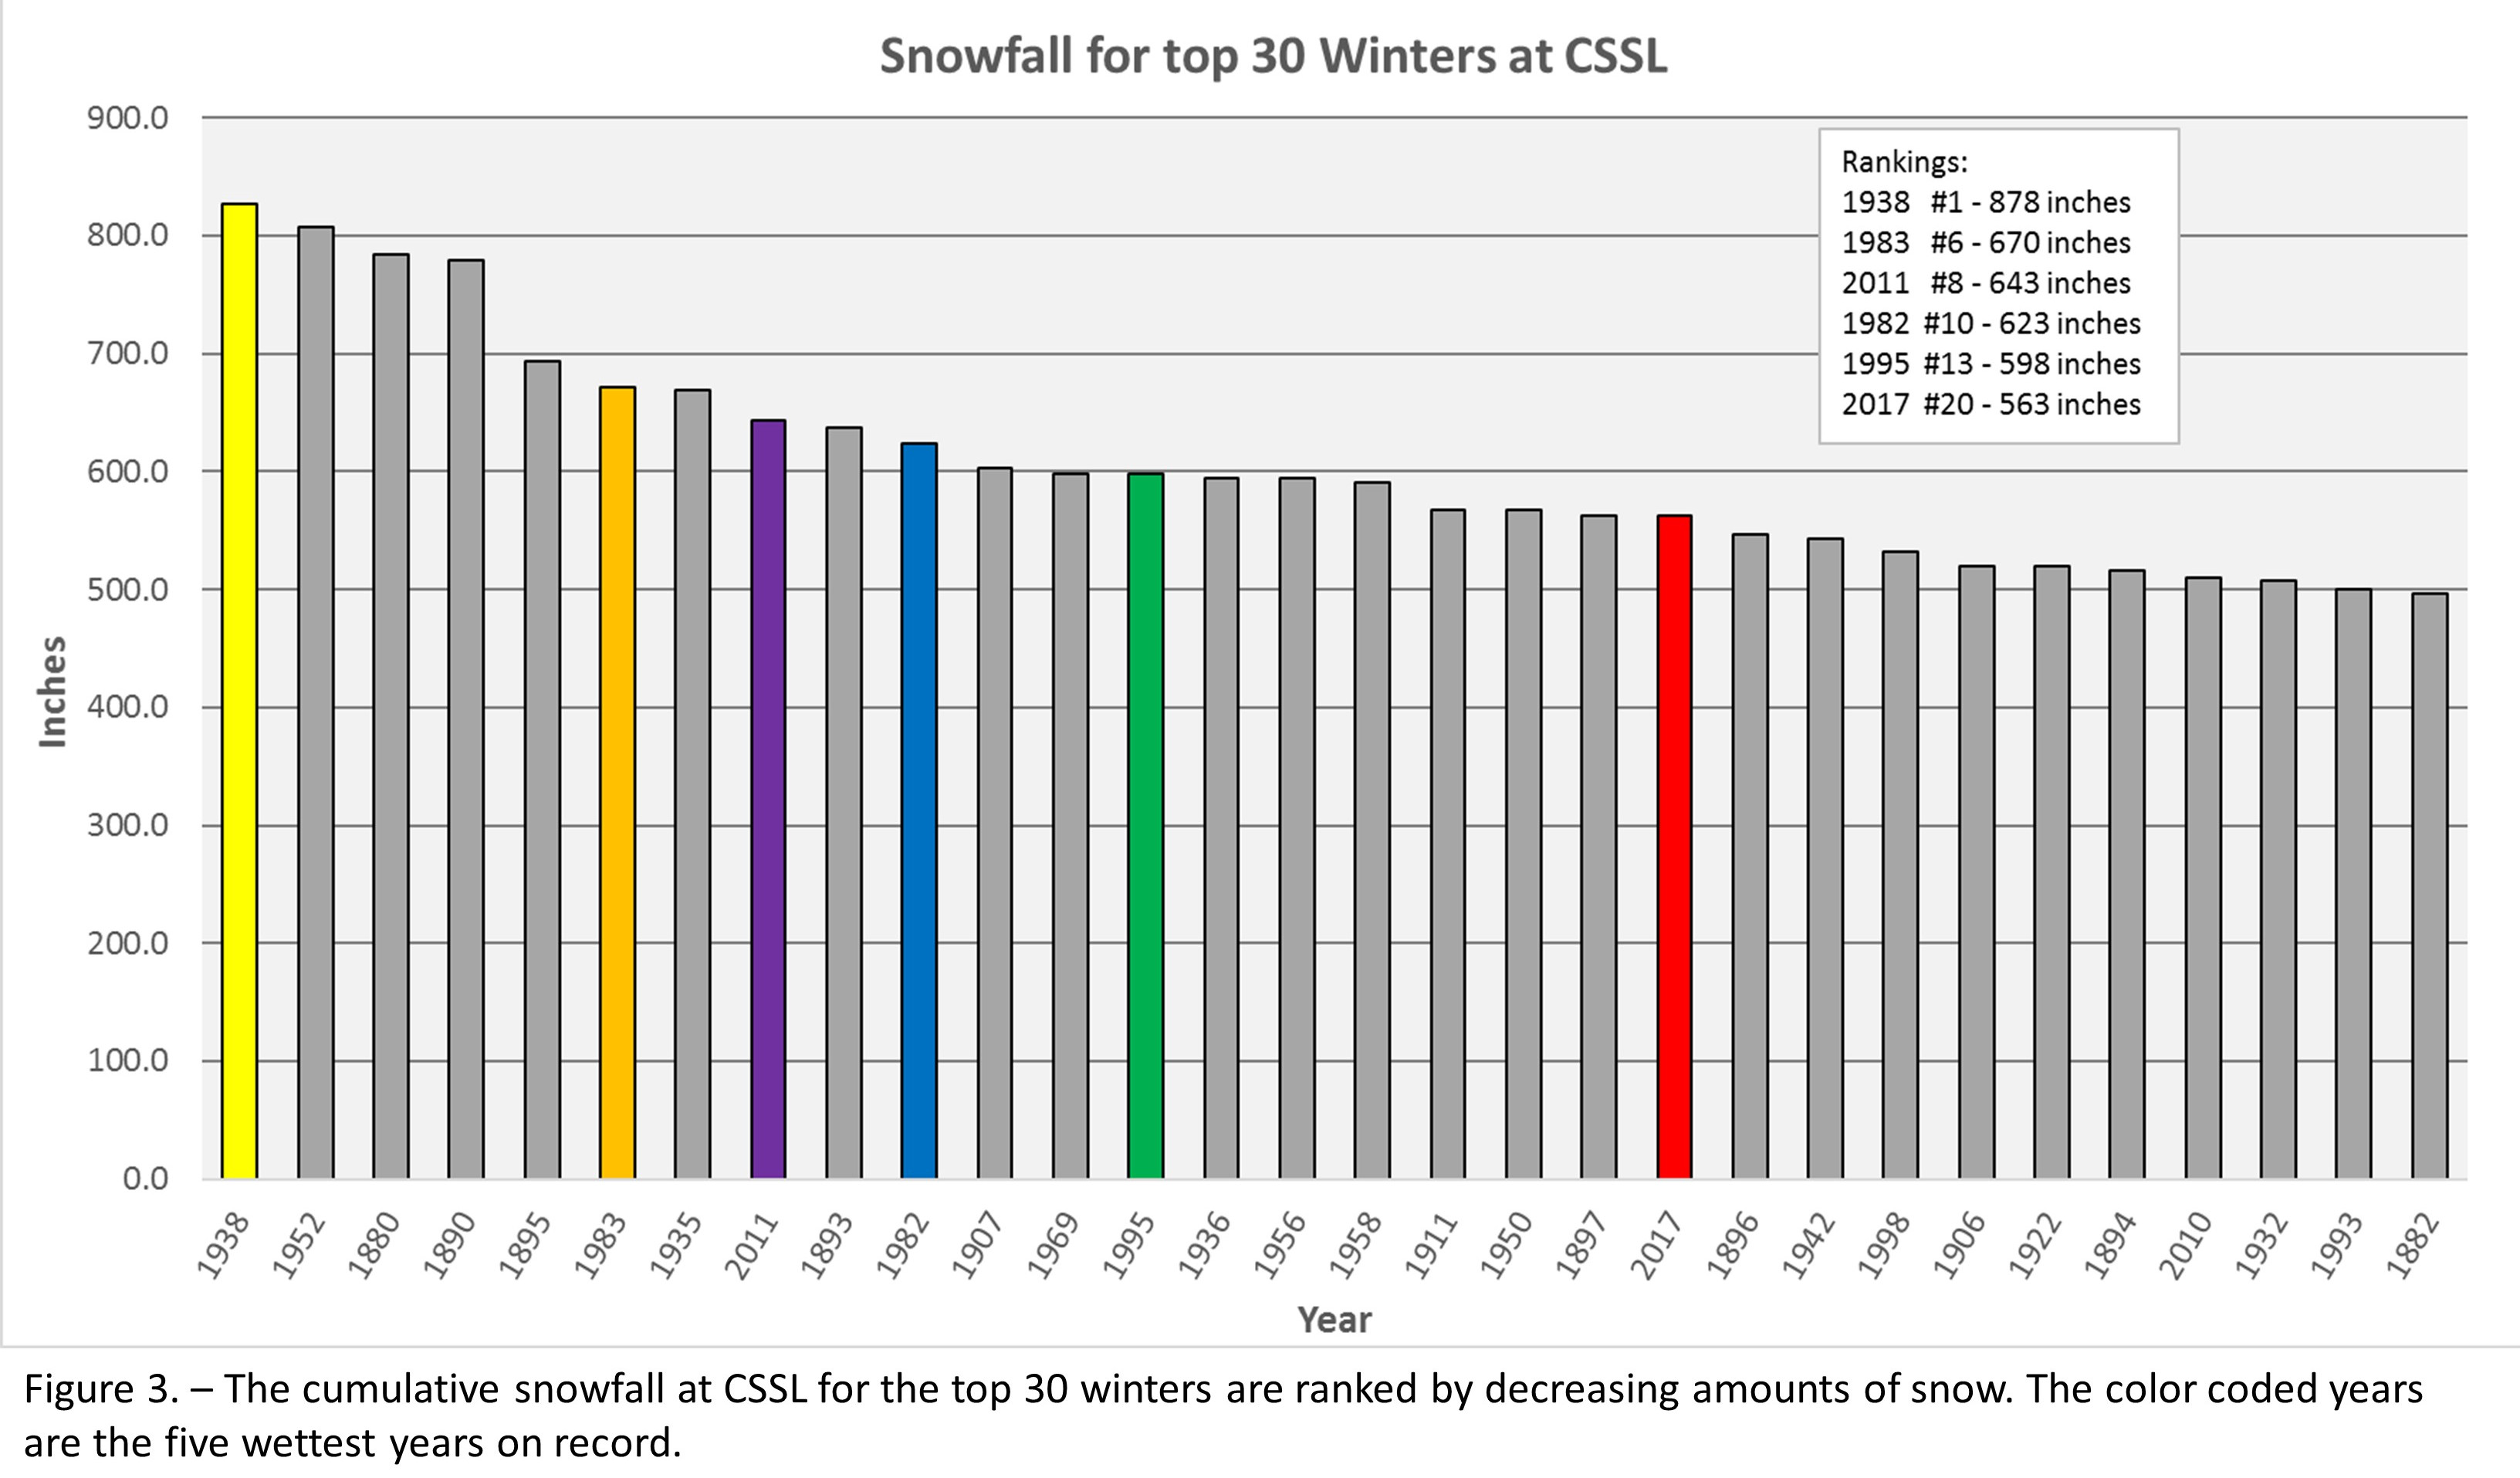
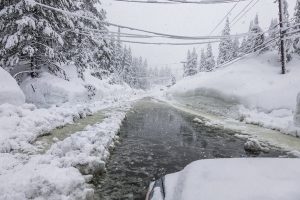
Flooding in Serene Lakes
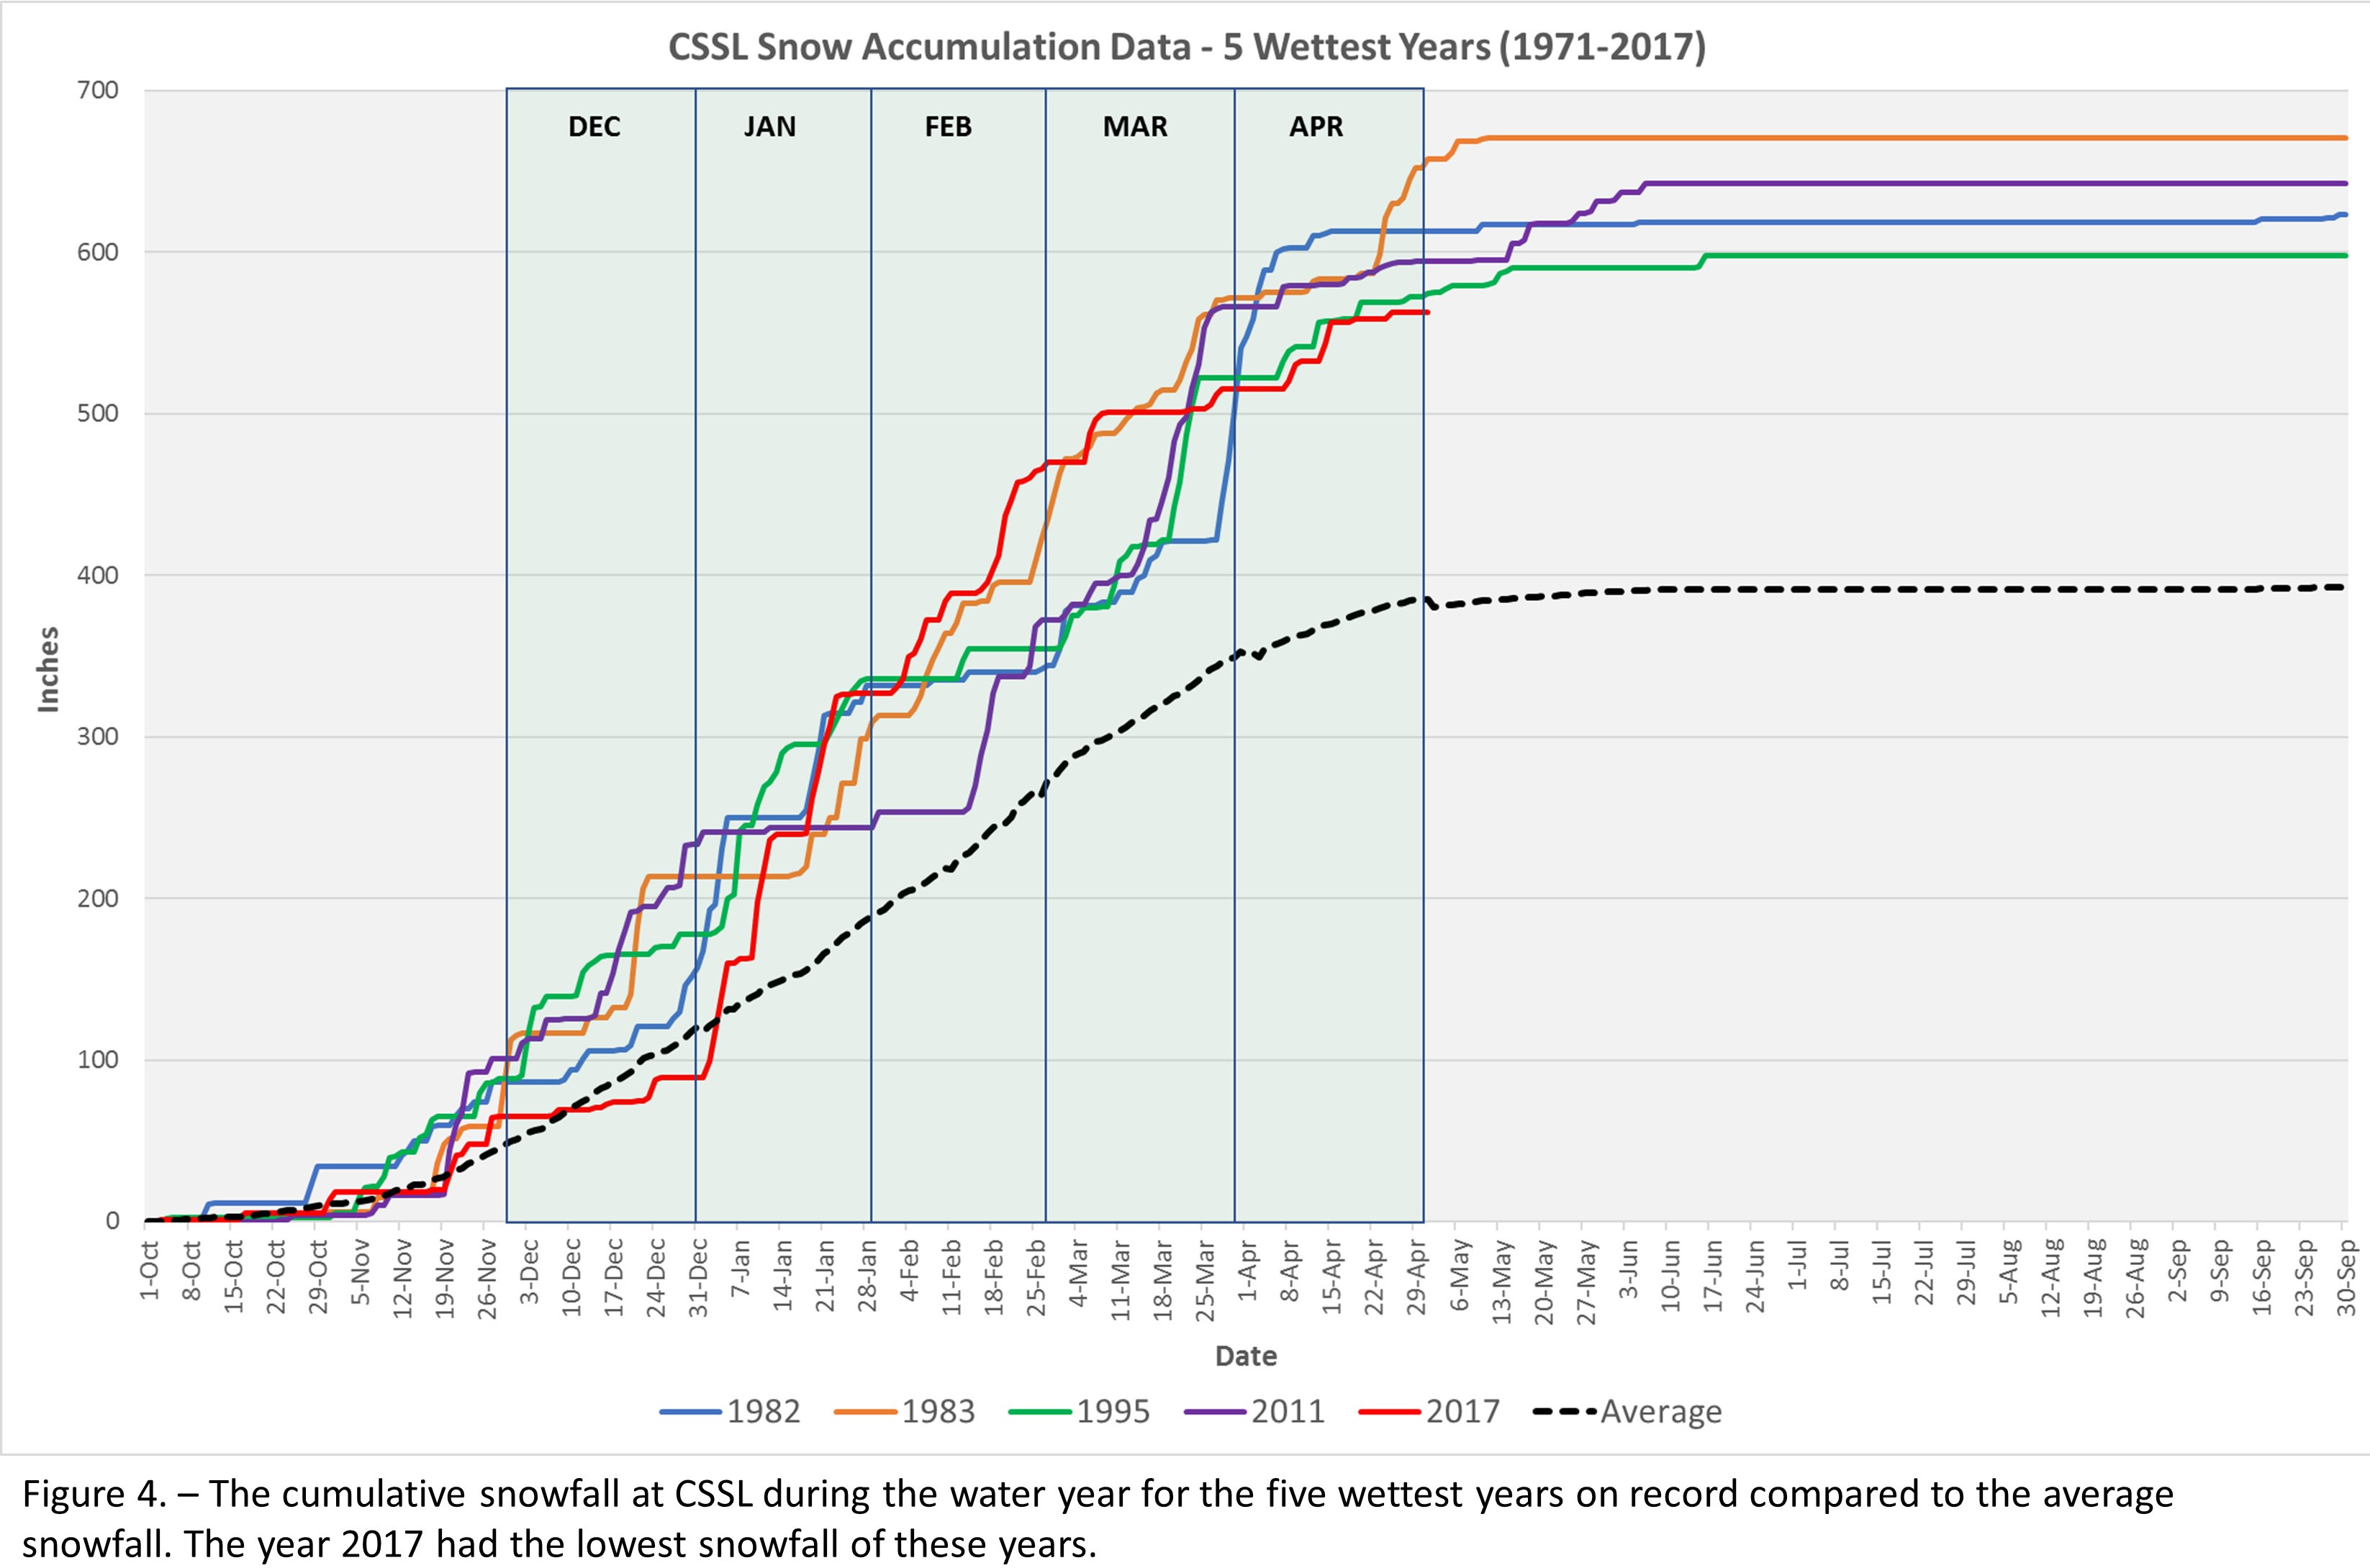
How did 2017 compare to the 5 wettest years on record? When the data for the five wettest years is compared in Figure 4, 2017 had the least amount of cumulative snowfall, considerably less than the top year of 1983 as well as the second-ranked year of 2011. The ramifications of this were particularly telling at the Summit. What the most precipitation but the least snowfall means is that instead of snowfall the Summit experienced heavy winter rainfall. This created repeated rain on snow events that resulted in some serious flooding in the Donner Summit communities of Soda Springs and Serene Lakes.
Maximum Snowpack Depth
Without a doubt, it is the amount of snow on the ground, the snowpack, that really determines the severity of a winter on the Summit. It is also the measure of how much snow there is to ski on and how much shoveling it takes to clear a deck. The height of the snowpack is, of course, a direct result of the cumulative snowfall, but the depth of the snowpack is dependent not only on snowfall but also on temperature, humidity and the amount of rainfall.
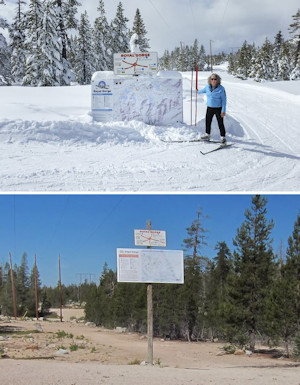
Snowpack at Royal Gorge 2017
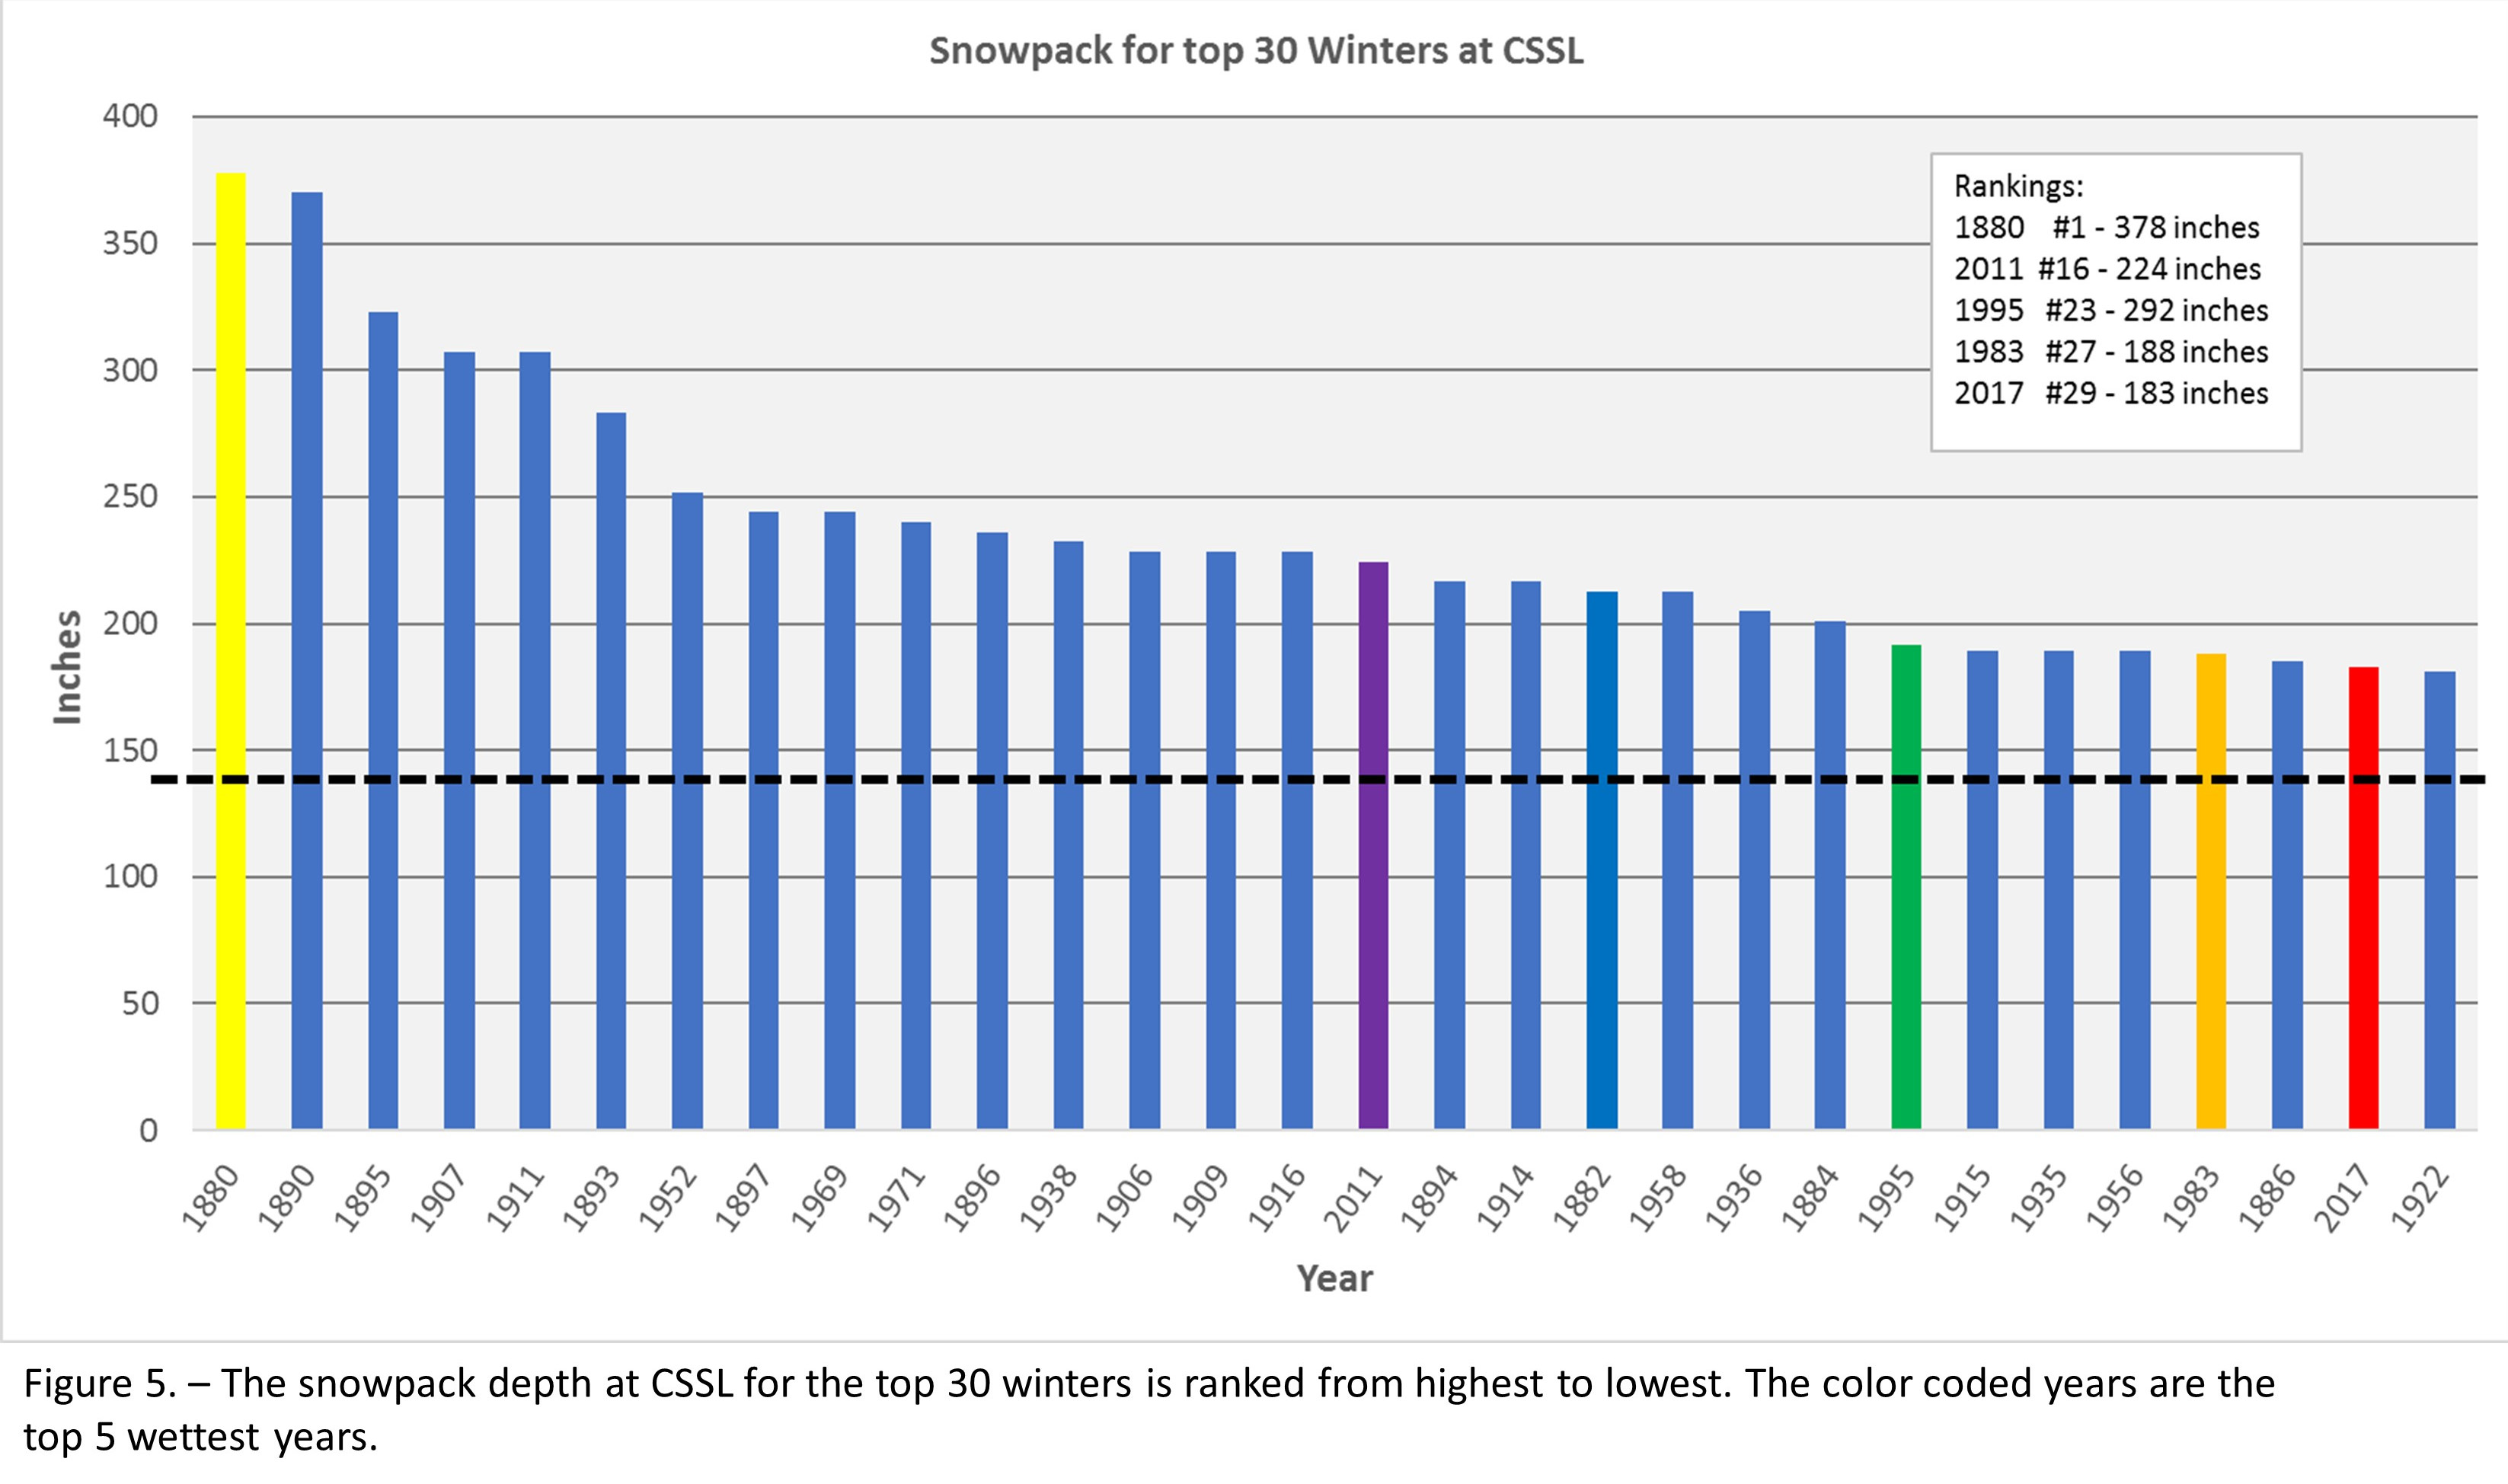
Heavy snowfall followed by warm temperatures and dry air can quickly reduce the snowpack by melting and sublimation. Heavy warmer winter rain storms can also deplete the snowpack. The variability of the snowpack is shown in Figure 5 which ranks snowpack depth for the top 30 winters and compares the snowpack depth for the five wettest years between 1971 and 2017. The new wettest year champion, 2017, ranks only 29th and the second wettest year did not even make the top 30. Clearly, overall precipitation does not correlate to snowpack depth. Moreover, when the rankings of cumulative snowfall in Figure 3 are compared to snowpack depth in Figure 5, the rankings differ considerably. Only the snowpack in 2011 even makes the top 20. Again, as with cumulative snowfall, the snowpack for 2017 was the least for the 5 wettest years.
A closer look at the snowpack depth during the water year really tells the story as shown in Figure 6. The snowpack depth for the 5 wettest years during the water year is plotted. The clear winner in maximum snowpack depth is the water year of 2011 when the depth reached 222 inches on March 26th. The plot also reveals another interesting aspect of the increases in snowpack. The steepness and height of rises in the depth indicate the intensity of the snowfall activity during those periods. Not surprisingly, one of the most intense 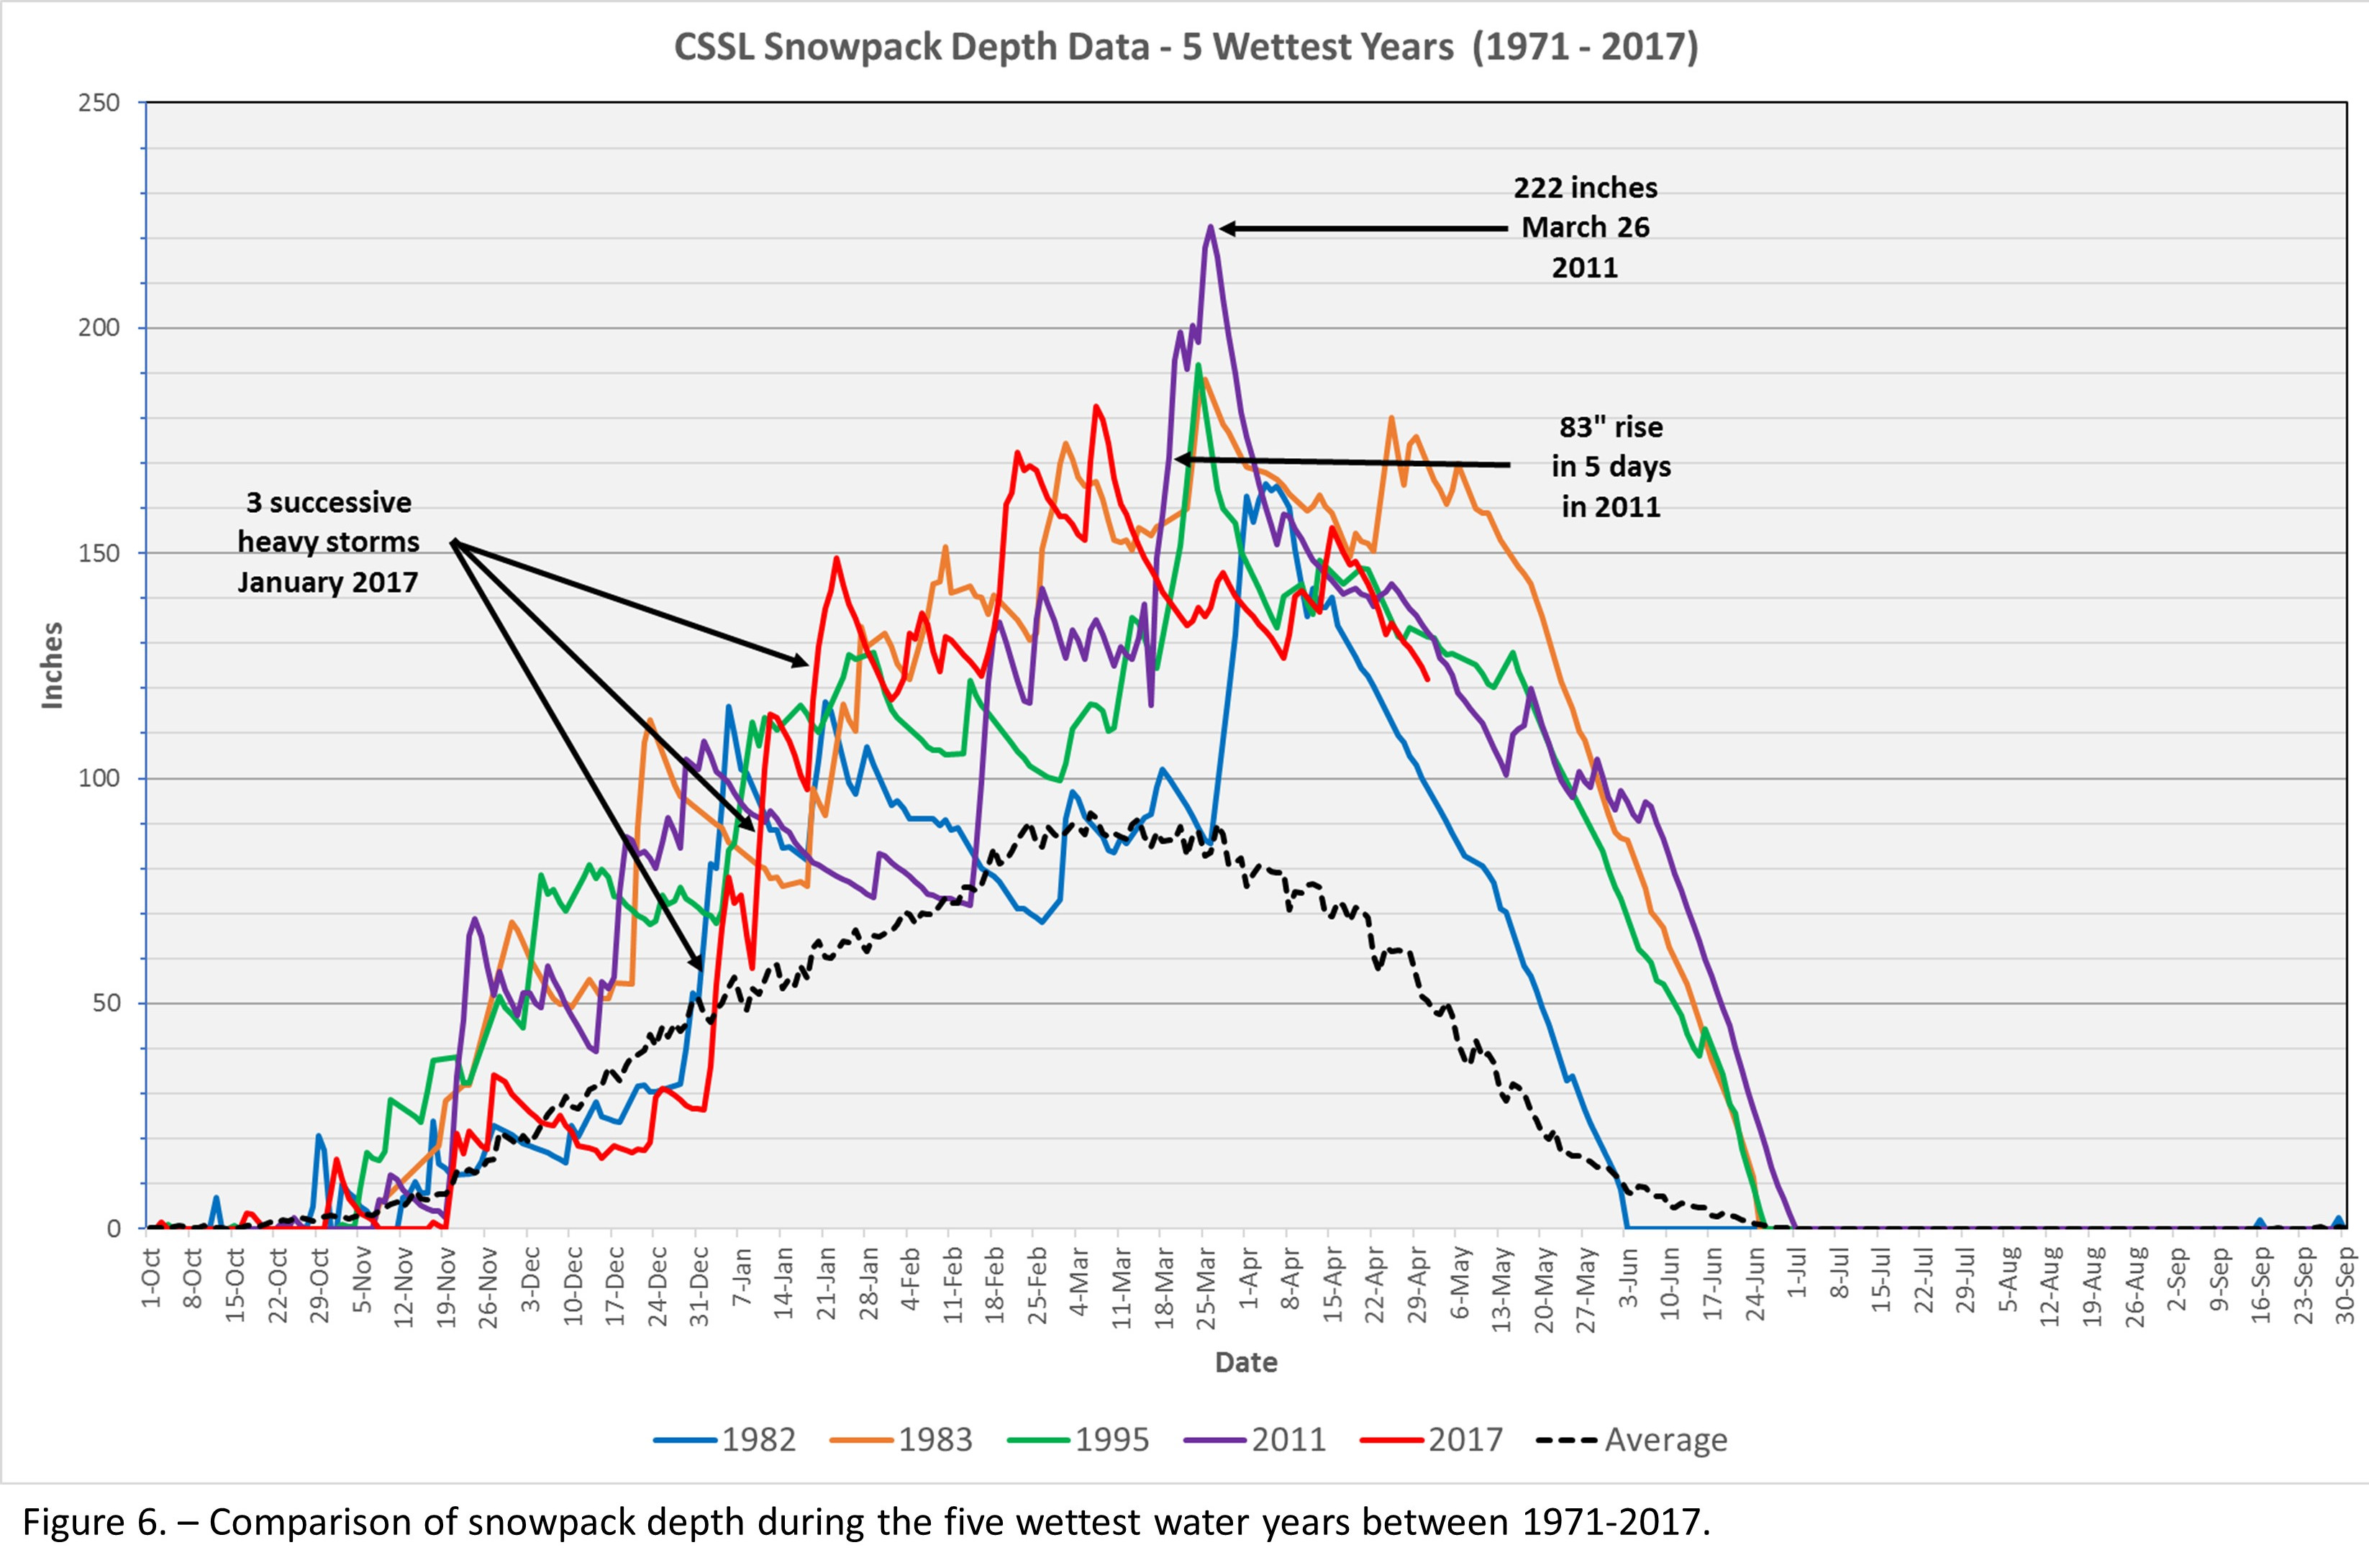 increases occurred in March of 2011 when there was an 83-inch rise in the snowpack in just 5 days that was quickly followed by an additional 24-inch increase to reach the 222-inch mark. Having driven a snow blower in Serene Lakes during that period, I can attest to the severity of those storms which essentially closed down Donner Summit for almost two weeks. The plot also shows the three successive storms that hit the Summit in January of this year that led to several days of closed roads due to heavy snow buildup and whiteout conditions. It made this January’s snowpack the highest of the 5 wettest years and much more severe than the relatively dry January of 2011. Although less intense, the increases in snowpack were also the highest in February of 2017 again outpacing 2011 and 1983. However, unlike the other wettest years, the winter storms relented and the temperatures rose in April and May resulting in a fall in snowpack depth that took 2017 out of the running as the snowpack champion.
As summer approaches the Summit, the question of how long will it be until we see the ground again still remains. Although incomplete for this year, the plot in Figure 6 shows a pretty clear trend for what to expect. Judging from the other wettest years it looks like we should not expect to see bare ground again until after the summer solstice in June.
Donner Summit is, of course, famous (or is it infamous) for its extreme winters. The heavy winter of 2017 only reinforces that fact. While it is interesting to analyze the numbers and make historical comparisons, the truth of the matter is that while it may not have been the biggest or toughest snow year, it was a tough winter up here and as history shows, we can expect more of the same in the future.
Thank you to Randall Osterhuber at CSSL for providing the data for this report
(Download a pdf of this article)